ProSight Font
Note: ProSight Font required to use Sequence Gazer™
Download ProSight Font
Microsoft Windows:
Mac OS:
Mozilla Firefox
Download
Internet Explorer 8+
Download
Sequence Gazer™ is a tool for using MS/MS data to test hypotheses regarding the characterization of a protein of known sequence. It allows the user to determine the likelihood that specific modifications exist at particular locations on the protein sequence.
Uses of Sequence Gazer™ range from confirming that a known PTM exists at a particular location to fully characterizing a poorly-known protein based on expert knowledge and theoretical expectation. It provides the means to quantitatively measure the quality of a putative characterization against MS/MS experimental data.
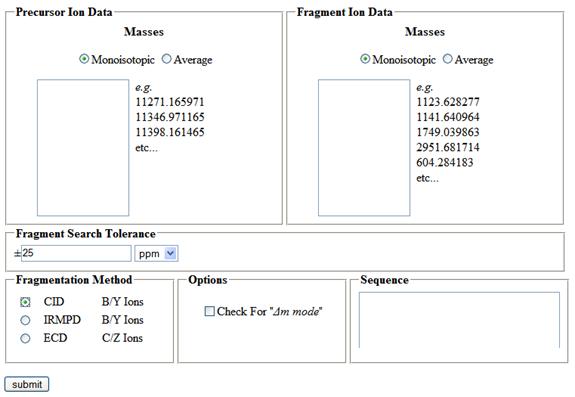
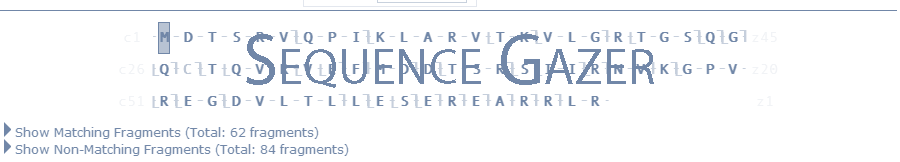
Figure 1 - Sequence Gazer™ Interface
The Sequence Gazer™ interface consists of a search definition page and a solution refinement page. To define a search, the user needs to provide the following information:
Sequence Gazer™ operates on lists of neutral masses. Algorithms (such as THRASH) analyze the isotopic distribution in the m/z domain and calculate the average neutral mass (average of the isotopic distribution). If there is sufficient information in the spectrum, the monoisotopic neutral mass (the mass resulting from only principal isotopes) may be extrapolated.
Once a search is defined, the user is presented with the solution refinement page. It displays the following sections:
To use Sequence Gazer™, you first need data to analyze. Sequence Gazer™ works on lists of neutral masses derived from MS/MS experiments. It does not work on data in the m/z domain! You may use algorithms such as THRASH or Decon to convert m/z data to neutral mass data.
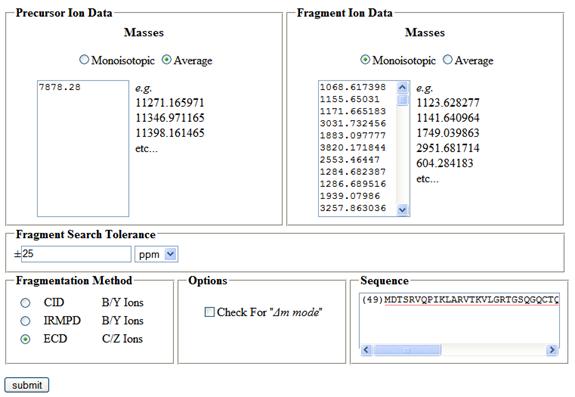
Figure 2- Typical Input Data
Once you have a list of intact neutral masses and a list of fragment neutral masses, it is time to define your search. Specify the type of mass that you are using (monoisotopic or average) for both lists, specify your fragment tolerance, and specify whether you want to use Δm mode. If you aren't sure what parameters to use, don't worry - all of these parameters may be modified later on, while you are refining your solution.
You must also specify the sequence of the protein you are attempting to characterize. This sequence should be as accurate as possible, since differences in sequence result in differences in mass, and lower the degree to which you can explain the data you obtained.
You may specify the fixed modifications you used here. This is your only opportunity to do so - there is no way to do it after you begin refining your solution, aside from discarding all your work and starting a new search.
Finally, add the intact and fragment masses to the appropriate boxes, and click Submit.
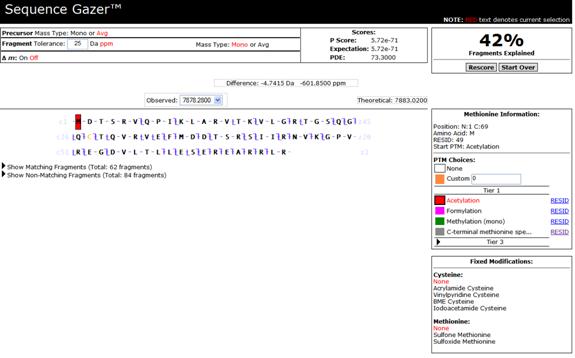
Figure 3 - Analysis View
You will initially be presented with a solution based on the unmodified protein sequence. You may now place modifications on particular residues to increase the degree to which your solution explains the data. Based on the fragmentation pattern of the protein, specify the residues you believe are modified, and the modifications on them. Once you have done so, click Rescore.
If your explanation for difference between the observed mass and the theoretical mass is valid, your overall score will improve, and the percentage of matching fragments will go up. If not, it will decrease. Your goal is to continue characterizing the sequence until you have reduced the difference between the observed mass and the theoretical mass of your solution to within the measurement error of your instrument.
Based on your expert knowledge of the sample, you may wish to examine the list of matching and non-matching fragments directly. By clicking on the arrows below the sequence display ("Show Matching Fragments", "Show Non-Matching Fragments"), you may expand those particular lists.
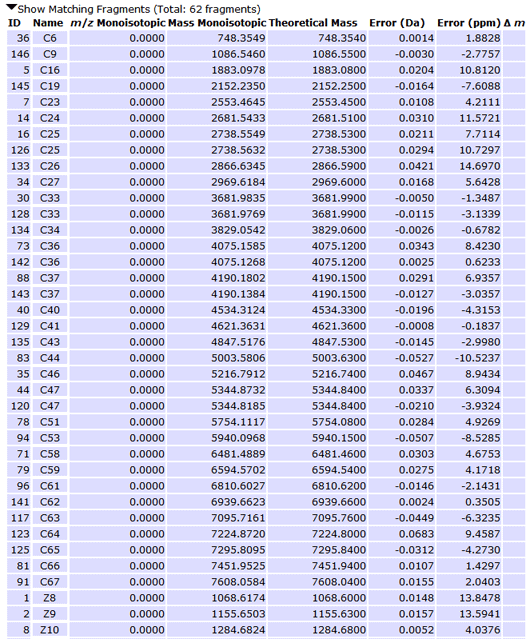
Figure 4 - Matching Fragment List
The m/z columns in Matching and Non-Matching Fragments, as well as the Intensity column in Non-Matching Fragments are not used in this version of Sequence Gazer™. They are used in NeuroProSight and ProSightPC™ when data is derived from a larger set of searches.
[1] Meng, F., B. J. Cargile, L. M. Miller, A. J. Forbes, J. R. Johnson and N. L. Kelleher. (2001) Informatics and Multiplexing of intact protein identification in bacteria and the archaea. Nature Biotechnology 19: 952-957.
[2] Reid, G. E., H. Shang, J. M. Hogan, G. U. Lee and S. A. McLuckey. (2002) Gas-phase concentration, purification, and identification of whole proteins from complex mixtures. Journal of the American Chemical Society 124: 7353-7362.
SequenceGazer was developed by the Kelleher Group
at Northwestern University
© 2014 Northwestern University